Taleb's Tail Risk of Contagious Diseases Summary
The following is a summary of the paper: Tail Risk of Contagious Diseases by Pasquale Cirillo and Nassim Nicholas Taleb.
In this paper, the authors explain the risk of contagious diseases. While COVID-19 has shown us how dangerous a pandemic can be, the authors show that the risk may be even greater.
The authors collected data from 62 major epidemics and pandemics. These are events with over 1000 casualties from 429 BC until today.
The authors rescale the data to make an important comparison point - death as a proportion of the population. This point is especially important given how global and interconnected our society is today.
"For example, the Antonine plague of 165-180 killed an average of 7.5M people, that is to say 3.7% of the coeval world population of 202M people. With respect to today’s population, such a number would correspond to about 283M deaths."
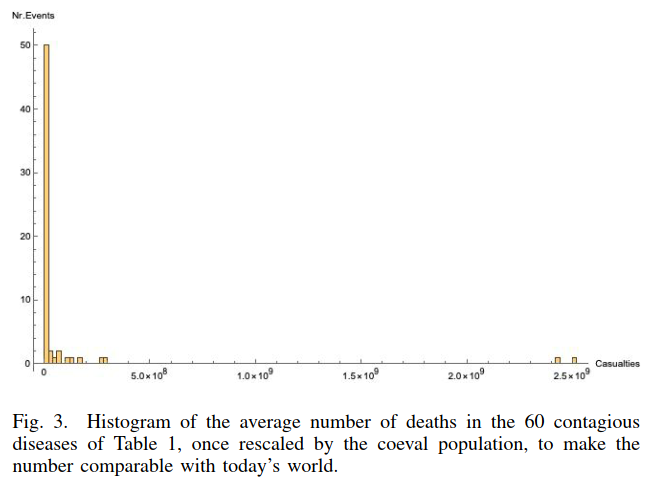
Using raw data, the sample average deaths from major epidemic and pandemic diseases is 6.1M with a median of 50K deaths and standard deviation of 20M. Using the rescaled data, the mean deaths is 100M, a standard deviation of 440M, and a median of 469K.

The authors note that this indicates that the casualties of contagious diseases are fat tailed and skewed. As shown by the histogram above, there are two events that are outliers. In short, there is potential for large, significant outlying events.
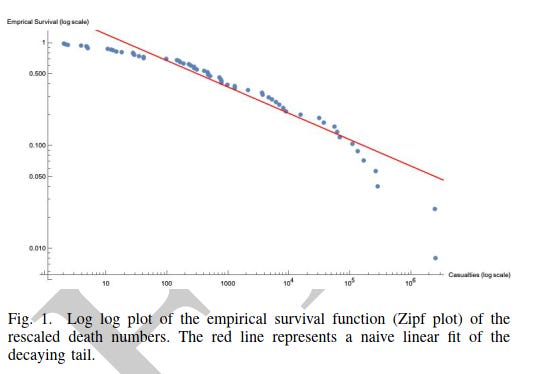
Another graph the authors use is the log log plot graph of the empirical survival functions for the average victims over the contagious events. The survival function is a function that gives the probability that the person survives.

A log log plot uses logarithmic scales on both the x and y axis. As each axis is nonlinear, we can spot fat tailed events with a linear plotted curve (in red). The simple takeaway from this graph is that there are impactful outliers. This helps us to rule out a thin tailed distribution. Ruling out thin tailed distributions is key to understanding the risk. As I lay out in a previous post:
"This leads to an important point in determining the appropriate distribution to fit to a data set. One should determine the distribution based on the process of elimination. This introduces the idea of a Black Swan. A Black Swan is a rare event – a big, impactful deviation from the normal. If you observe a Black Swan in the data set (say a 10 sigma event) you can now say the distribution is thick tailed (Extremistan) by elimination. You cannot certify that it is thin tailed because this 10 sigma event has appeared. Because of the Black Swan, you now know that you are living in Extremistan."
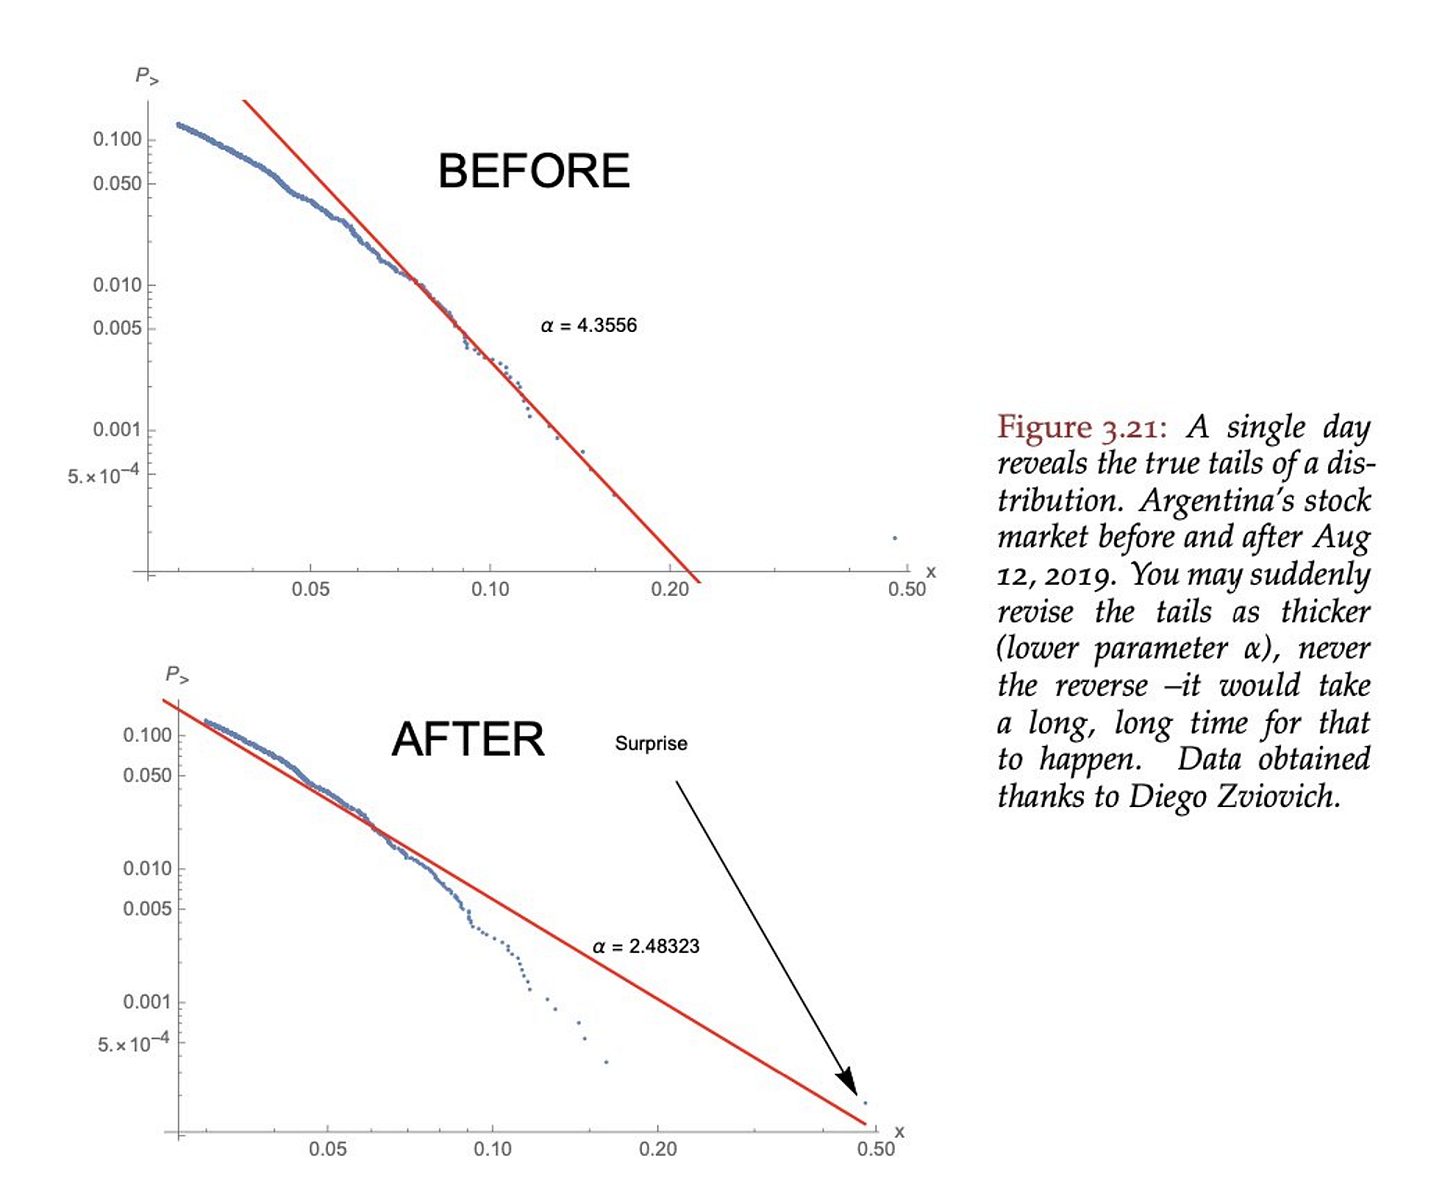
The erratic behavior exhibited by these distributions shows that there is potential for extreme outliers. We have seen similar log log plots used to prove that other distributions are not thin tailed. Take, for example, the Argentina stock exchange following August 12, 2009. In the chart below, we see that one day in the Argentina stock exchange reveals that the distribution is fat tailed.

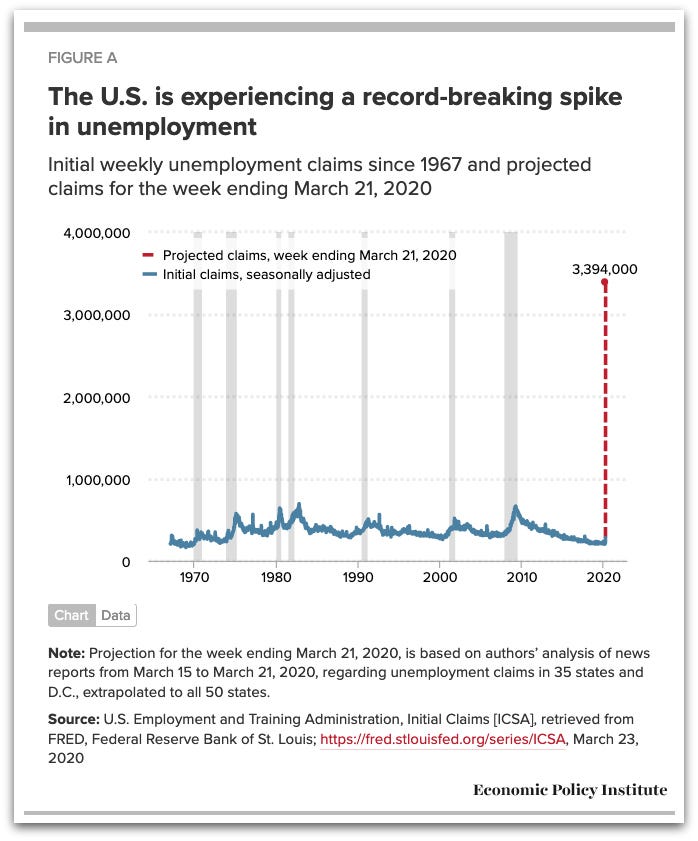
Similarly, we saw the same extreme variance just last week with about 3.4 million jobless claims in the US. The existence of these tail events are not “30 sigma” events, however, as many people are reporting. The existence of a “30 sigma” event likely means that the wrong distribution is being used to measure the standard deviation. In reality, the jobless claims distribution is a fat tailed distribution, just like pandemics.

Given the contagious diseases distribution is likely fat tailed, the authors bring in the possibility of it being an infinite mean phenomenon. A Pareto distribution with α = 1 , for example, has the possibility of an infinite mean as its tail is “heavy enough.”
With the population of the world, however, there is an upper limit (total people). The authors call this an apparent infinite-mean phenomenon. Obviously, there couldn’t be 80 billion people who die from a pandemic. To deal with this, the authors put an upper bound that scales out impossible events from the distribution.
Given the timeframe of available data, there are obvious concerns over the reliability of the data. The authors do some Monte Carlo simulations to confirm the robustness of the data - 10,000 copies of the data allowing the data to fluctuate between 80% and 120% of the recorded value. The findings remain the same.
In conclusion, this paper concludes a fundamental point of risk analysis. The distribution of a pandemic belongs in Extremistan. When determining the distribution of data (thin tailed vs. fat tailed) we use a process of elimination. Once we find events that prove the distribution to be fat tailed, we know the risk is much higher.
“The existence of an existential threat should impact policy making in a serious way and override all niceties from epidemiological and other models which should be limited to informing decisions on matters that lay outside the tails of the distribution.”


